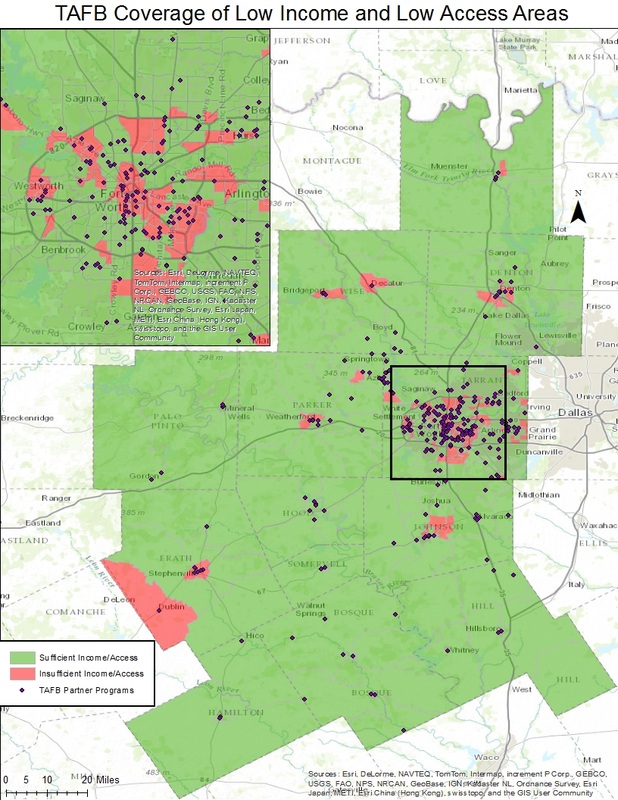
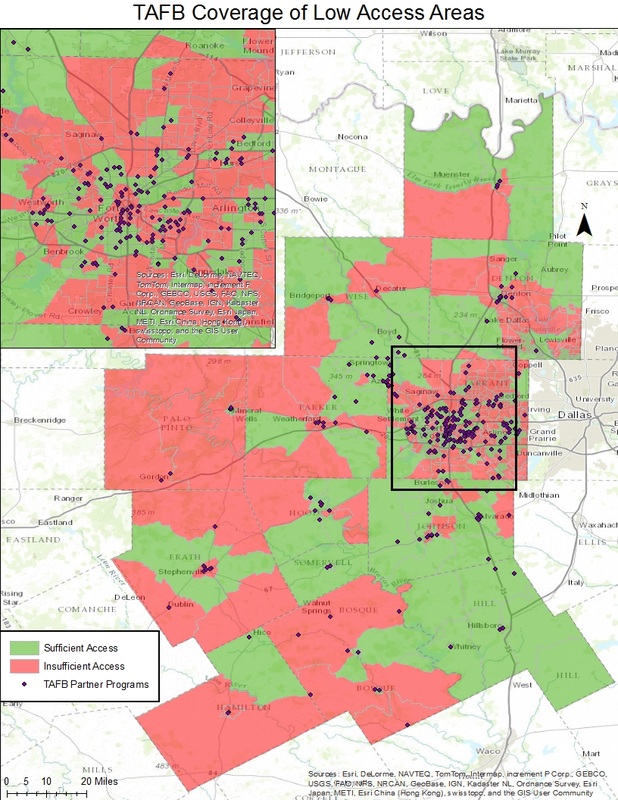
Highest Need Areas
These maps demonstrate the highest need areas within the 13 counties served by the TAFB. In order to determine whether or not a group of people is living in a food desert, we first need to determine how much access that population has to grocery stores. All of the maps show the location of TAFB Partner Programs in order to see how well the TAFB is meeting the needs of the at risk areas. The bottom map displays census tracts that meet that basic criteria. For urban tracts, this means that grocery stores are inaccessible at 1 mile, and for rural tracts, grocery stores are inaccessible at 10 miles. However, this map does not take income, a variable largely responsible for the food people eat, into account. The middle map, therefore, highlights census tracts that have a low average household income as well as low access to grocery stores based on the aforementioned criteria. Clearly, many of the census tracts that were of concern in the bottom map are no longer as concerning when income is considered. The majority of at risk census tracts also appear to be urban tracts. And the census tracts within the Fort Worth city limits exhibit variation when it comes to food access. In order to better assess these at risk census tracts, we created an interactive map that, when you zoom in, shows the population within each at risk census tract but at the block level. This information will be valuable to the food bank when deciding which specific areas especially require the food assistance. As you zoom in, the partner programs go from being all grouped together to being categorized by their specific function. This will also allow the food bank to determine which services are already in place and which services could be introduced.